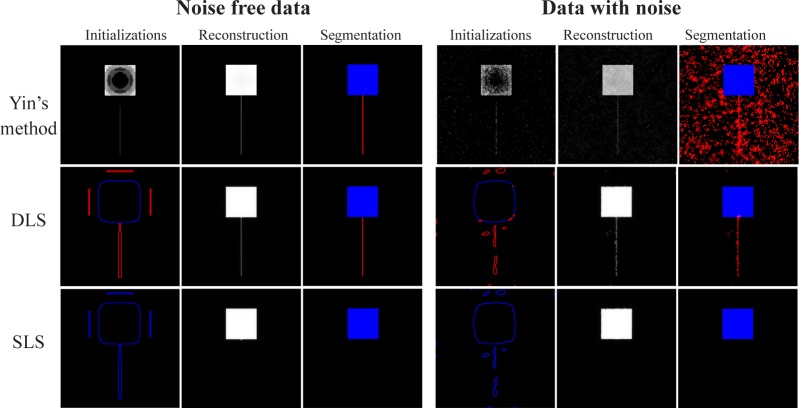
Fig. 10.
Results comparison among Yin’s model [2, 3] and the Single Level Set (SLS) and the Double Level Sets (DLS) model for Fig. 9(b) and (c) above. Columns 1-3: Initializations, reconstruction results and segmentation results. Rows 1-3: Yin’s model, SLS and DLS model (top to bottom) for noise free data. Rows 4-6: Yin’s model, SLS and DLS model (top to bottom) for data with noise.

