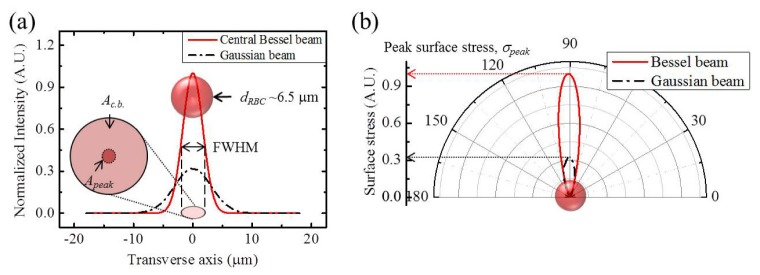
Fig. 5.
(a) The normalized intensity of the central beam of our AFBG (red solid) and a Gaussian beam used in prior reports [5,6] (black dash dot line) at the 100 mW beams. Inset image is the typical size of Red Blood Cell. Ac.b. is the total FWHM beam area of the central beam. Apeak is the central peak beam area within 1 μm2. dRBC is the diameter of red blood cell. (b) The polar profiles of total surface stress on one surface of single RBC by Gaussian and Bessel-like beam.

