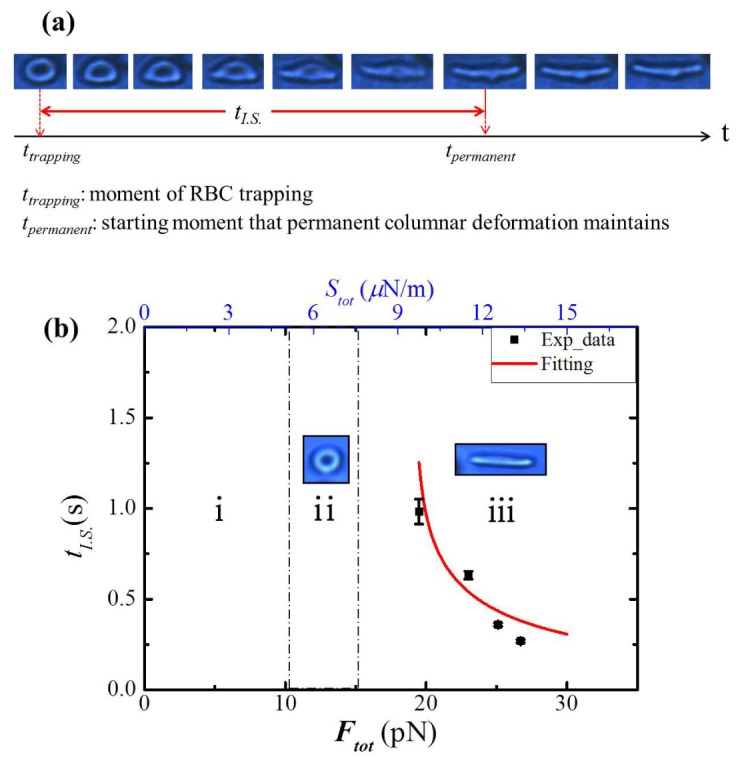
Fig. 9.

(a) Sequential images of a irreversibly stretched single RBC (see Visualization 1 (1.6MB, MP4) ) and definition of irreversible stretching time tI.S. (b) tI.S. as a function of Ftot and Stot. Distinctive deformation region of optical stretching as a function of Ftot acting on RBC (i: Neither trapping nor stretching, ii: Trapping & Reversible stretching, iii: Irreversible stretching) The number of measured samples is 12 (Each data includes 3 measured RBC samples). Fit curve was derived in Eq. (7) and was approximated to the experimental data (red-line).
