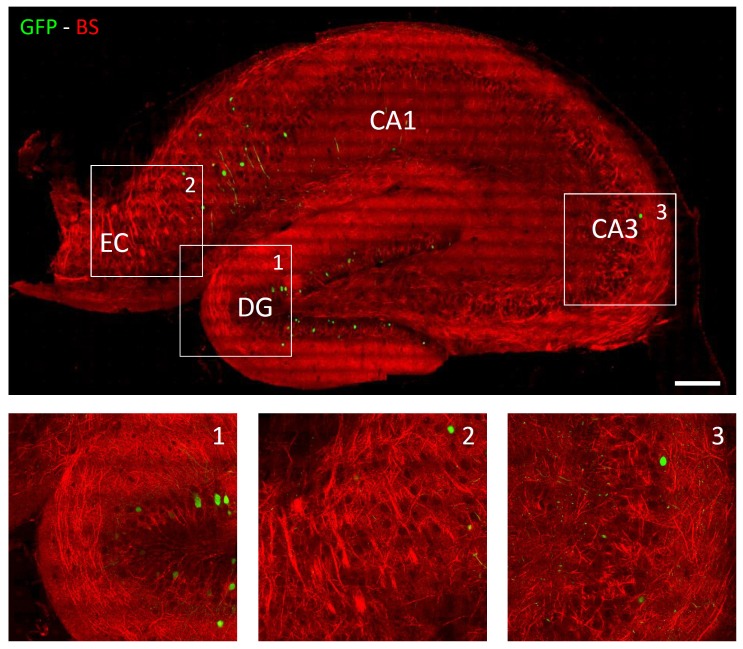
Fig. 3.
Thy1-GFPM mouse hippocampus imaging. Reconstruction of a coronal slide of a Thy1-GFPM mouse hippocampus fixed with PFA: in red there is the reflectance signal, in green the fluorescence signal. The upper panel shows the rendering of maximum intensity projection (MIP, depth = 5 µm) of stacks stitched together to reconstruct the entire coronal slide. Scale bar = 100 µm. (1, 2, 3) High magnification inset corresponding to white boxes in the upper panel highlighting the different organization of axonal fibers in the hippocampal areas DG, EC and CA3.

