Fig. 4.
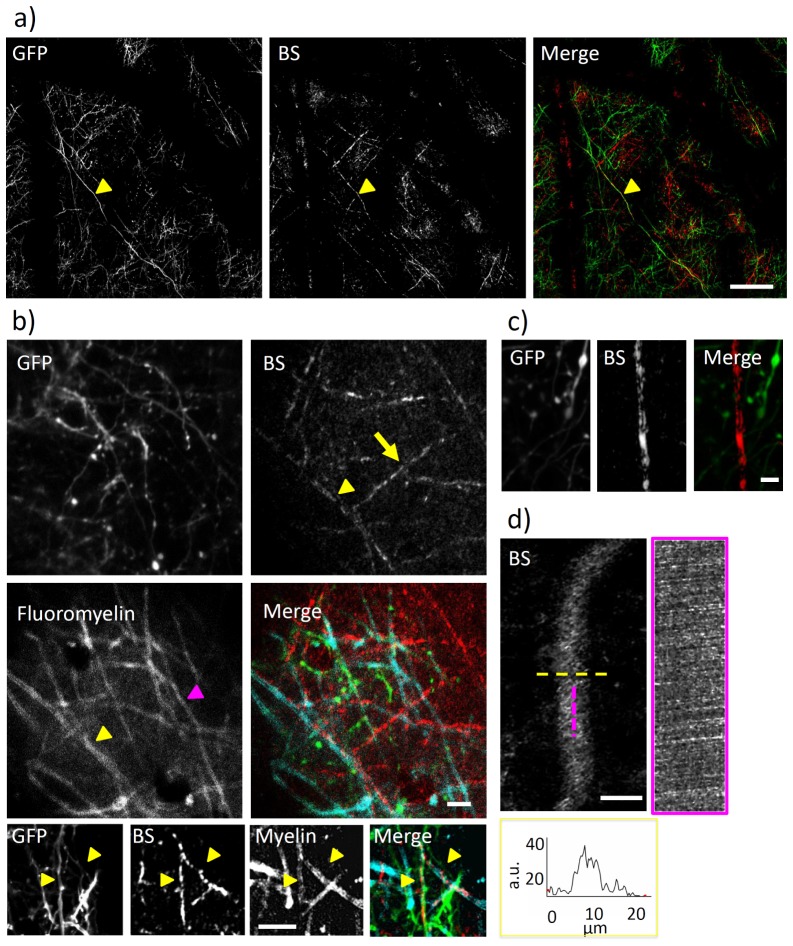
In vivo NIR reflectance and two-photon fluorescence imaging. a) Mosaic of 4 × 4 maximum intensity projections from 60 µm deep stacks (90 × 90 µm wide, 10 µm overlap between the stacks). Colocalization of an axon in the fluorescence and BS channel, as pointed out by the arrowhead. Scale bar, 50 µm. b) Upper panels are MIP of TPF and BS images showing the possible colocalization of the BS signal with Fluoromyelin labeling (as highlighted by the yellow arrowhead). Yellow arrow points at a BS filament not colocalized with Fluoromyeling signal. The magenta arrowhead highlights a Fluoromyelin labeled axon which is not visible in the BS channel. Scale bar, 20 µm. Lower panels show an example of colocalization of NIR reflectance signal (BS) with GFP fluorescence and with Fluoromyelin labeling on the same axons (highlighted by yellow arrowheads). c) MIP of TFP and BS images where a binary of reflectance signal shows the sides of the myelinated tube. d) Blood capillary as visualized by NIR reflectance imaging. By performing line scans along the magenta and yellow line, we could measure blood flow velocity and lumen diameter (respectively) from the NIR reflectance signal. The graph on the right reports the profile of BS signal measured by the line scan (yellow line) on the blood vessel. Unless otherwise stated, scale bar = 10 µm.

