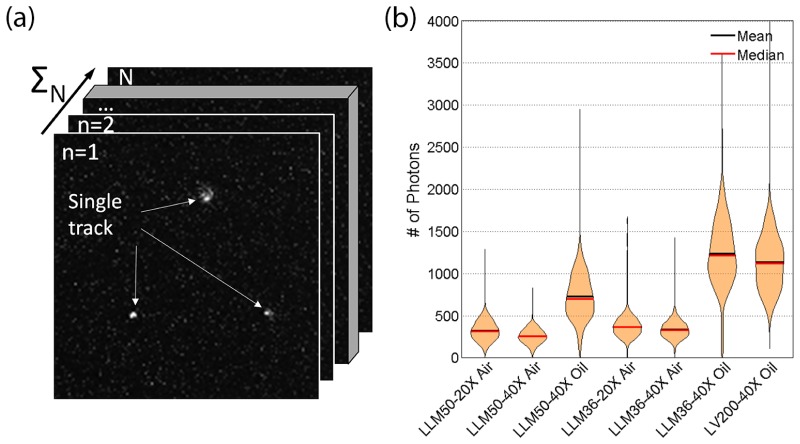
Fig. 5.
(a) Example of raw scintillation image. The individual tracks are evaluated and analyzed throughout the entire image stack. (b) Violin plot of histograms representing number of photons captured with different tube lens – microscope objective combinations. The widths of the violin plot have been normalized to facilitate visual comparison of the brightness performance (actual widths vary as the number of counts increases drastically with lower magnification or greater field of view).

