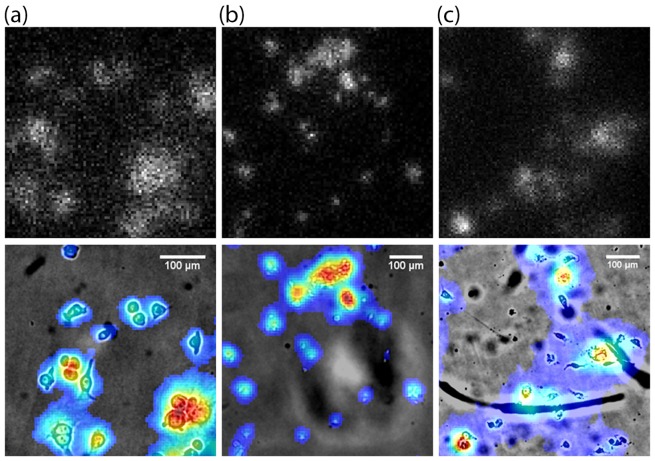
Fig. 7.
Radioluminescence images of MDA-MB-231 cells captured using (a) LLM50, (b) LLM36 and (c) LV200. Red color represents higher radioactive decay from the cells. The top row represents raw scintillation counts and the bottom represents the radioluminescence data smoothed with Gaussian filter and overlaid onto a micrograph of the MDA-MB-231 cells.

