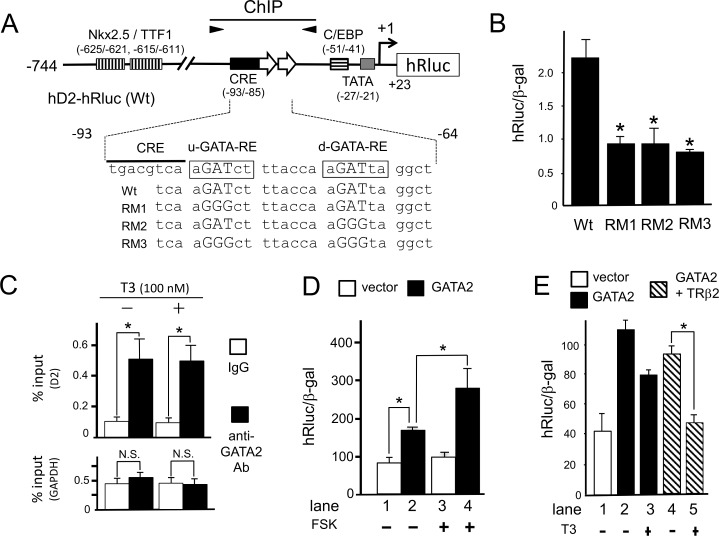
Fig 7. Involvement of GATA2 in T3 negative regulation in the thyrotroph cell line, TαT1.
(A) A schematic representation of hD2-hRluc (wild-type, Wt) and its mutants. (B) The hD2 promoter is activated by endogenous GATA2 via u- and d-GATA-REs. Using the lipofection method, 2.0 μg hD2-hRluc and its mutants (RM1, RM2 and RM3) were transfected into TαT1 cells. *, P<0.05 for hD2-hRluc (Wt) vs. mutants. (C) In the absence or presence of 100 nM T3, ChIP assay was performed in TαT1 cells using an antibody against GATA2 or control mouse IgG. Immuno-precipitated chromatin fragments were amplified by PCR with primers for the mouse promoter. The positions of primers in the mouse D2 gene that correspond to the position of the human D2 gene are indicated by closed arrowheads in (A). Left panel, mouse D2 gene; right panel, mouse glyceraldehyde 3-phosphate dehydrogenase (GAPDH) gene. The signals were measured by quantitative real-time PCR. The values are expressed as percentages relative to the levels with anti-GATA2 antibody at 1 h. *, P<0.05. N.S., not significant. (D) After TαT1 cells were transfected with hD2-hRluc along with or without pcDNA3-mGATA2, the cells were incubated in the presence or absence of 10 μM forskolin for an additional 24 h. *, P<0.05. pGL4.74 [hRLuc/TK] (2.0 μg/well) was used as the inter-assay control and its expression level was adjusted to a value of 100. (E) After TαT1 cells were transfected with hD2-hRluc along with or without pcDNA3-mGATA2 and/or pCMX-rTR2, the cells were incubated in the presence or absence of 1 μM T3 for an additional 24 h. *, P<0.05. The results are means ± S.E. for three independent experiments. pGL4.74 [hRLuc/TK] was used as the inter-assay control and its expression level was adjusted to a value of 100.

