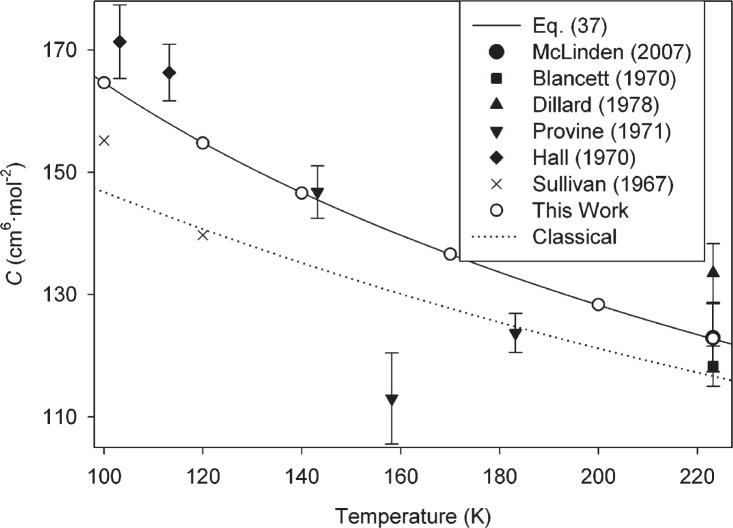
Fig. 3.
Comparison of C(T) calculated in this work with experimental values at moderately low temperatures. Error bars on experimental points (drawn where reported) represent expanded uncertainties with coverage factor k = 2; expanded uncertainties for this work (given in Table 1) are not shown on the figure because the error bars would be smaller than the symbols.

