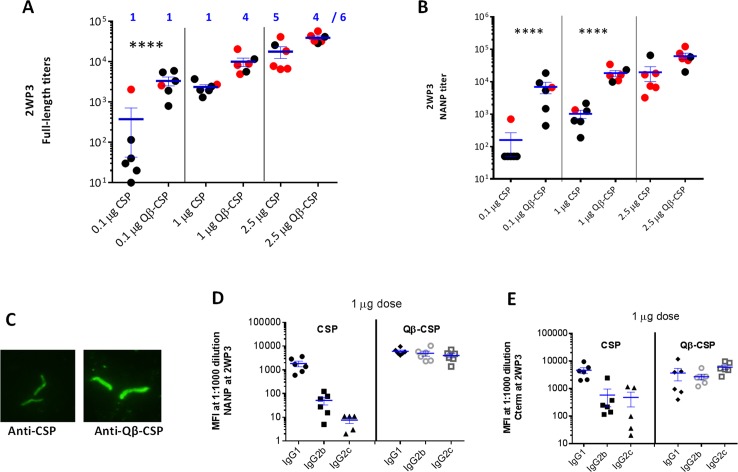
Fig 3. Qβ-CSP vs. CSP in Montanide.
Groups of 6 mice were vaccinated thrice with 2.5, 1 and 0.1 μg CSP or Qβ-CSP in Montanide. A, B show the individual data points and mean±SEM titers against full-length protein (A) and NANP repeat peptide (B) 2 weeks post 3rd vaccination (2WP3). **** (p<0.0001 for ANOVA followed by Tukey’s multiple comparisons test); red data points correspond to mice protected 14 days post challenge and numbers (blue) were protected out of 6. C, Immunofluorescence image of methanol fixed sporozoites stained with 1:2500 dilution of anti-CSP pool (left) or Qβ-CSP serum pool (right) for the 1 μg dose groups. D, E show IgG1, IgG2b and IgG2c levels measured by Luminex and expressed as median fluorescence intensity (MFI) at 1:1000 serum dilution against the NANP peptide (D) or the C-term protein (E).

