
Figure 12.
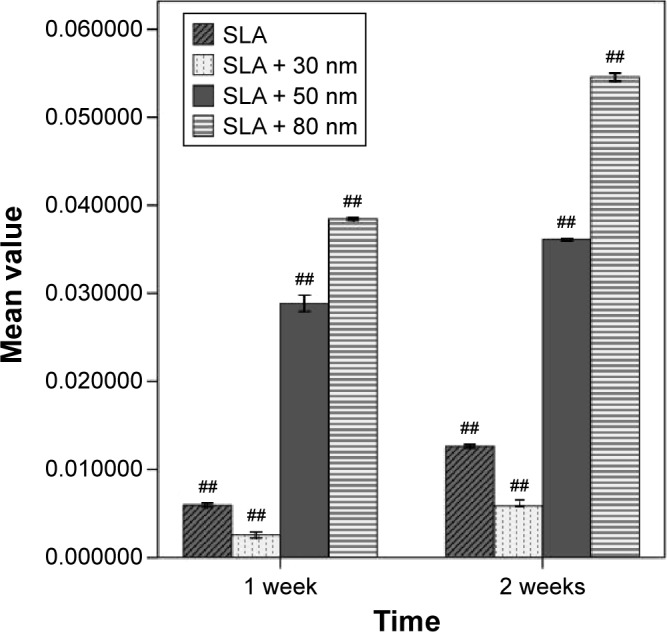
Comparison of the OCN mRNA expression level of different types of cells (n=3, ± S).
Note: ##A significant difference in comparison with all other groups (P<0.01).
Abbreviations: OCN, osteocalcin; SLA, sandblasting with large grit and acid etching.