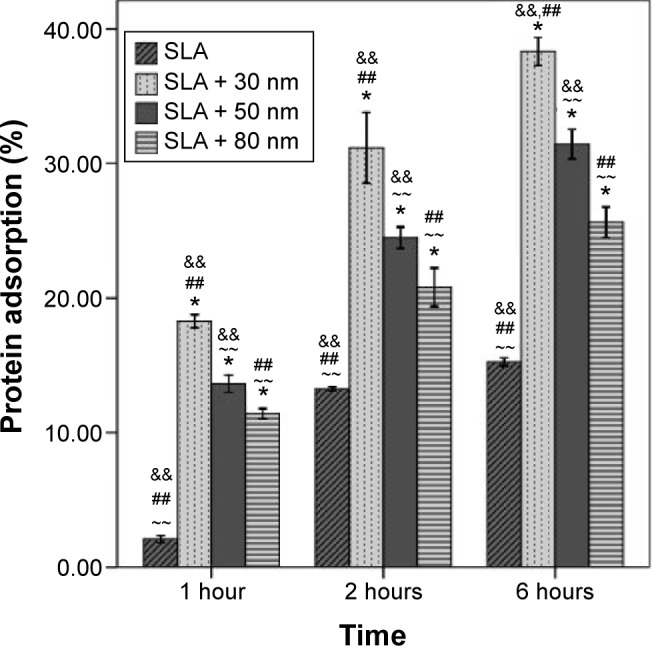
Figure 4.

Protein adsorptive rates of the SLA, SLA + 30 nm, SLA + 50 nm, and SLA + 80 nm surfaces assessed using a model protein.
Notes: The SLA + 30 nm group had the highest protein adsorption rate compared with the other groups regardless of incubation time. Among the other three groups, more protein was adsorbed on the surface of the SLA + 50 nm group relative to the other two groups. The SLA group had the lowest protein adsorption rate at different incubation times. *P<0.01 compared with SLA; ~~P<0.01 compared with SLA + 30 nm; ##P<0.01 compared with SLA + 50 nm; and &&P<0.01 compared with SLA + 80 nm.
Abbreviation: SLA, sandblasting with large grit and acid etching.
