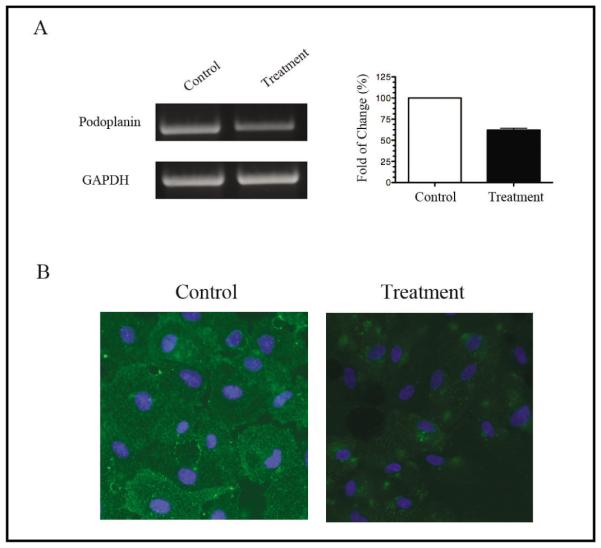
Fig. 3.

Podoplanin depletion from RPE cells in vitro. (A) Semi-quantitative RT-PCR analysis of the podoplanin gene in RPE cells 24 hours after the siRNA transfection. Right panel: band density analysis from repetitive assays. The mRNA levels of the control groups were presented as 100 percent. (B) Representative micrographs from immunocytofluorescent microscopic assays showing a significant reduction in podoplanin protein expression in the RPE cells 48 hours after the siRNA transfection. Podoplanin: green; DAPI nuclear staining: Blue. Original magnification: X200.
