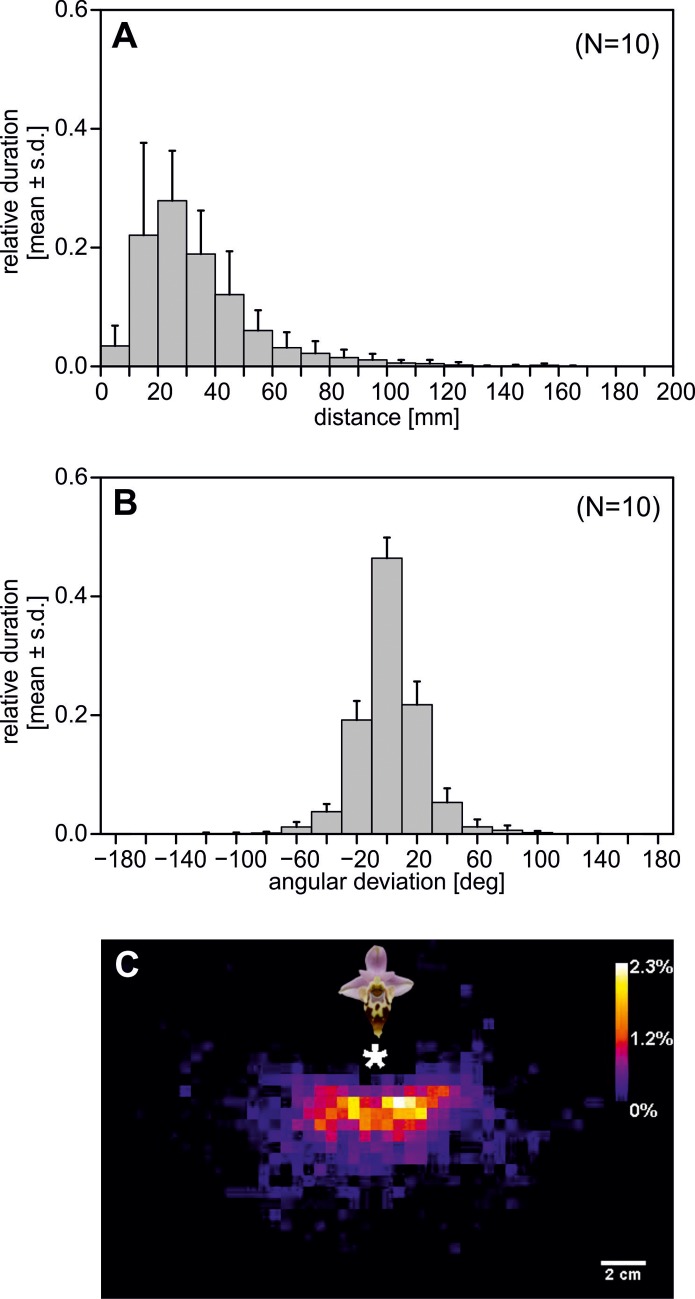
Fig 4. Scanning behavior of Eucera berlandi males after pseudocopulation on an Ophrys heldreichii flower (N = 10 flights).
(A) Relative scanning duration at various distances from the flower. (B) Angular deviation of the bees’ longitudinal body axis and the straight line between bee and orchid flower. (C) Bee position during a scanning flight in one representative trial in top view (sequence length 100 seconds). Colors represent the probability of presence in each 5x5mm pixel. The asterisk marks the position of the flower. Error bars show the standard deviation from the mean in (A) and (B).

