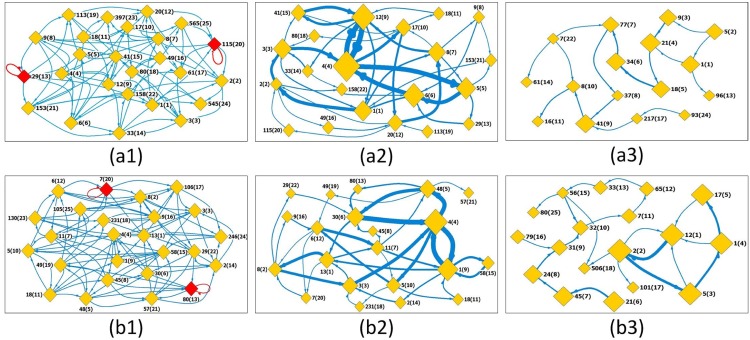
Fig 4. State transfer networks for stock markets.
Segment length is selected to be s = 5. (a1) and (b1) display the original state transfer networks for S&P500 and Nasdaq respectively. The label x(y) means the state occurs for the first time at the position x along the time series (the x’th segment), and its identifier number is y; (a2) and (b2) are the strong state transfer networks constructed by filtering out weak links (less than 25) in (a1) and (a2), respectively. While, (a3) and (b3) are the corresponding networks (weak links also are filtered out) constructed from shuffled series. Statistical average is conducted over 1000 realizations. Except in networks shown in (a1) and (b1), the size of a node indicates the occurring degree of the state. The width of an edge is the link’s weight.

