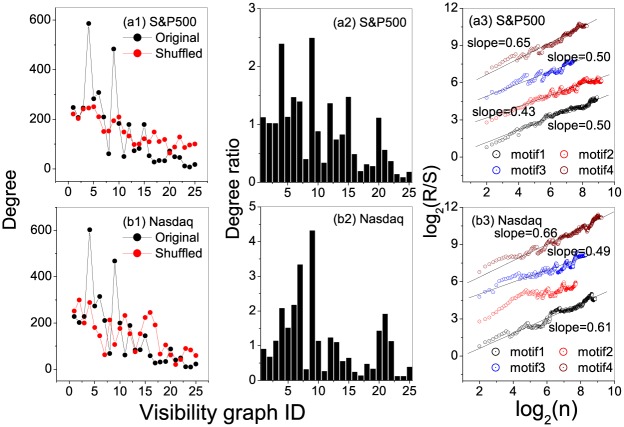
Fig 5. Degree, degree ratio, and persistent behaviors of motifs for the stock markets.
Segment length is selected to be s = 5. (a1)and (b1) show the occurrence degrees of the states in the original and shuffled S&P500 and Nasdaq index series, respectively. From the occurrence degrees one can easily identify hubs in the original and shuffled series; (a2)-(e2) present the degree ratios for all the states in the S&P500 and Nasdaq index series, respectively. From the ratios one can easily find the the motifs. A state being called a motif means that its degree in the original series is significantly larger than that in the shuffled series; (a3)-(e3) Relations of R/S versus n obtained from occurring position series of the motifs, from which one can find persistent behaviors of the motifs’ occurring along the series.

