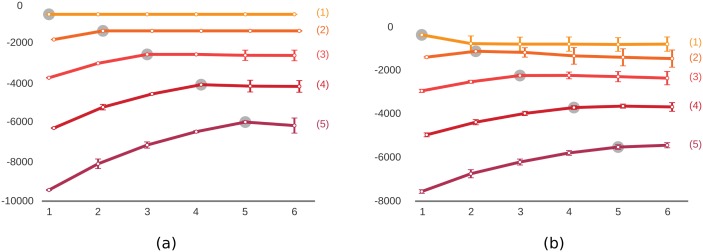
Fig 2. Results of simulation studies on predicting the number of communities.
The true number of communities is given in parenthesis next to each curve. The proposed inference algorithm was run with different number of communities (x-axis) and the log-likelihood (y-axis) was calculated for each. The maximum log-likelihood is marked with the gray circle indicating the predicted number of communities. (a) Networks were generated using the pure community structure defined in Eq 4. (b) Networks were generated using the hybrid structure defined in Eq 7. Vertical bars show standard deviation for repeated experiments; some lines are shifted slightly along the x-axis to prevent overlaps. The true number of communities was predicted successfully for all experiments.

