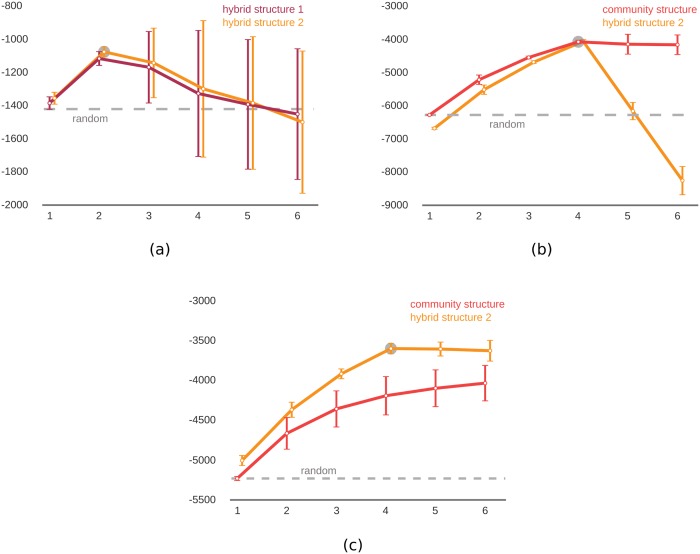
Fig 3. Model comparisons with different ground-truth meso-scale network structures.
The proposed inference algorithm was run with different number of communities (x-axis) and the log-likelihood (y-axis) was calculated for each. The maximum log-likelihood is marked with the gray circle indicating the predicted number of communities. Dashed gray line shows the log-likelihood for a random network. The ground-truth meso-scale structure was (a) the hybrid structure 2 (Eq 8), (b) the community structure (Eq 4), (c) the hybrid structure 2 (Eq 8). Vertical bars show standard deviation for repeated experiments; some lines are shifted slightly along the x-axis to prevent overlaps. The true models achieved higher likelihood in all pairwise comparisons, with the true number of communities achieving the maximum value in each case.

