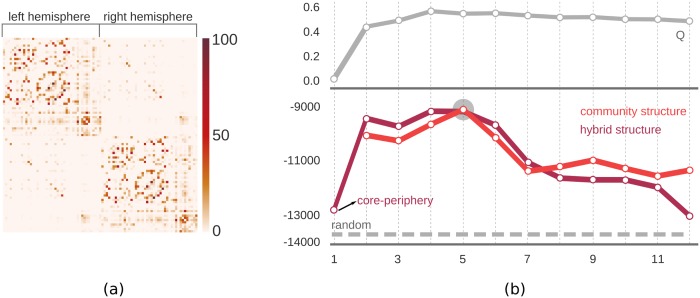
Fig 4. Meso-scale structures of the human brain network.
(a) The connectivity matrix of the brain that defined the network. Edges between nodes were weighted by the number of streamlines (normalized so as to have values between 0 and 100). (b) Model fits with different candidate meso-scale structures; three structures were compared. The proposed inference algorithm was run with different number of communities (x-axis) and the log-likelihood (y-axis) was calculated for each. The upper panel gives the modularity measure (Q) for different number of communities. Comparison with Q shows that the change in the likelihood value as we increase the number of communities, is similar to the change in the traditionally used modularity measure.

