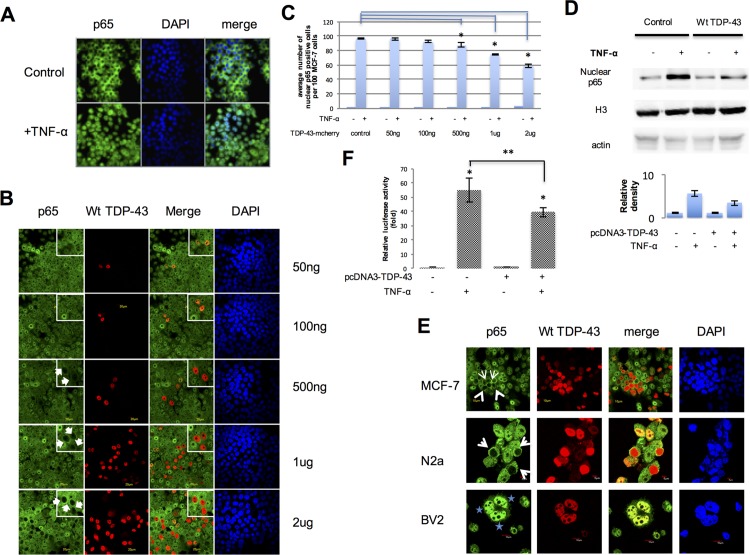
Fig 1. Overexpression of TDP-43 on p65 activation.
A. p65 (Green) is translocated into the cells’ nuclei (Blue) after 30 minutes of 10ng/ml TNF-α treatment (n = 3 repeats). B. MCF-7 cells were transfected with various doses (indicated on the right) of wild type TDP-43 tagged with mCherry expressing plasmids (middle panel, red) and were treated with 10ng/ml TNF-α for 30 minutes. In the top right corner, insets of higher magnification show the localization of p65 and nuclear TDP-43 staining (n≥3 independent experiments). C. The quantification of B. D. MCF-7 Cells were transfected with 4μg plasmid encoding TDP-43 tagged with mCherry or mCherry empty plasmid (control) and treated with 10ng/ml TNF-α for 30 minutes. Nuclear proteins were isolated and detected by western immunoblotting. Histone H3 was used as a nuclear marker. The relative density was the average of 3 individual experiments. E. MCF-7, Neuro 2a and BV2 cells were transfected with Wild type TDP-43 tagged with mCherry expressing plasmids (middle panel, red). MCF-7 and Neuro 2a cells were treated with 10ng/ml TNF-α for 30 minutes; BV2 cells were treated with 10μg/ml LPS for 30 minutes. Arrows indicate the blocked p65 nuclear translocation by Wt TDP-43 and stars indicate the normal p65 nuclear translocation with Wt TDP-43 overexpression. n≥3 independent experiments. F. The plasmid encoding TDP-43 tagged with mCherry or mCherry empty plasmid (control) was cotransfected along with NF-κB-luc (containing the wild type NF-κB-binding site). Cells were treated with 10ng/ml TNF-α for 30 minutes. Luciferase activity was measured after 24 hours. The plotted error bars represent mean±SEM from 3 independent experiments; *p < 0.05 compared to control, one-way ANOVA. ** p < 0.05 compared to the TNF-α treated control samples, Student's t test.

