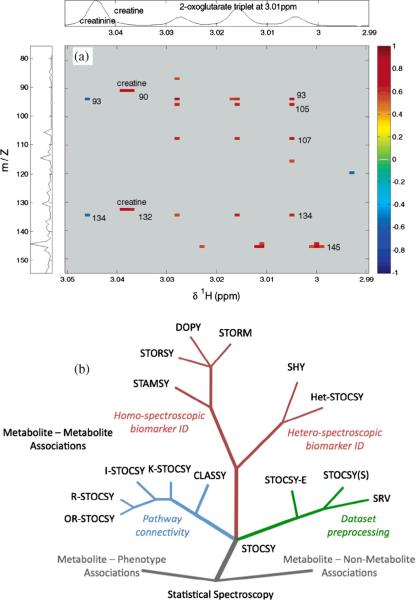
Fig. 10.
(a) An example of correlation of NMR and MS heterospectroscopic (SHY) data for unknown identification. And (b) statistical spectroscopy family tree. Branches in the tree show different variants of statistical spectroscopic tools used for compound identification, data preprocessing, and metabolic pathway analysis [reproduced with permission from Refs. [60,61]].

