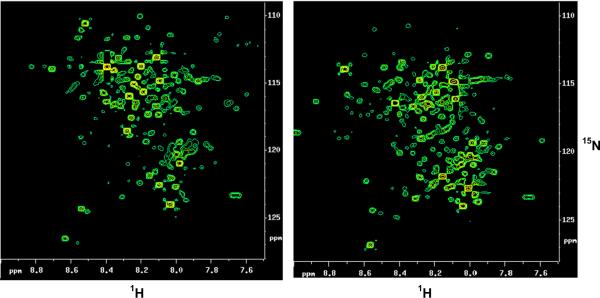
Fig. 14.
2D 1H–15N HSQC spectrum of human urine (left) and serum (right) obtained after tagging carboxyl-containing metabolites with 15N-ethanolamine. Nearly 200 metabolite signals are detected and a large number of these have been identified by comparing the chemical shifts with those of standard metabolites derivatized separately [reproduced with permission from Ref. [74]].

