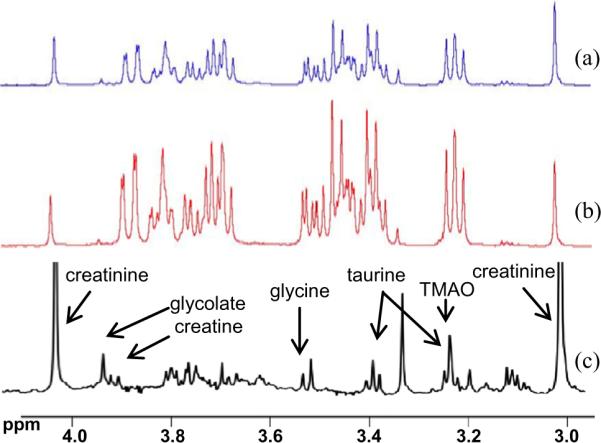
Fig. 7.

“Add to Subtract” approach for glucose peak removal: (a) 1H spectrum of urine with dominant glucose (added to mimic diabetic urine); (b) spectrum obtained after adding a small drop (a few μL) of external glucose to the biological sample in (a); and (c) “glucose free” spectrum obtained using “Add to Subtract” approach. Note that the vertical scale is enhanced for the spectrum in (c) to highlight clear identification of low intensity peaks that were buried underneath the abundant glucose peaks [modified from Ref. [31]].
