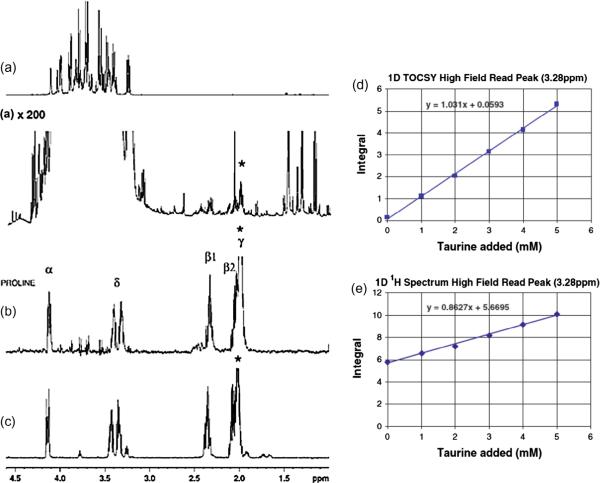
Fig. 9.
Left: (a) 1D proton spectrum of honey acquired using 1D NOESY sequence with presaturation for water suppression; (b) selective TOCSY spectrum of honey with selective excitation on the proline γ peak (1.98 ppm); (c) selective TOCSY spectrum for a mixture of 10 mM l-proline and 10 mM l-arginine with selective excitation on the proline γ peak (1.98 ppm). Note, in (b) low concentration proline peaks are clearly isolated from the complex honey spectrum using selective TOCSY method. Right: Titration of taurine into a human urine sample, showing (d) integral of 1D TOCSY spectrum around 3.28 ppm, and (e) integral of 1D proton spectrum around 3.28 ppm. Note, in (e) taurine is overestimated due to overlap in the 1D 1H spectrum, while it can be measured accurately using selective TOCSY as shown in (d) [modified from Refs. [40,41].

