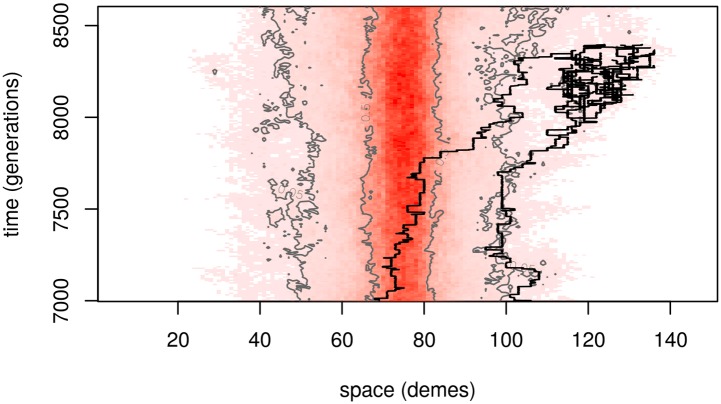
Fig 2. A segment of the temporal dynamics of the same simulation as Fig 1B.
Space is again shown across the horizontal axis, with time on the vertical axis; demes are colored darker red the greater their allele frequency at the corresponding time. The 50% and 5% frequency contour lines are in grey, and the genealogy of 50 individuals in a rare long-distance excursion is traced back with black lines.

