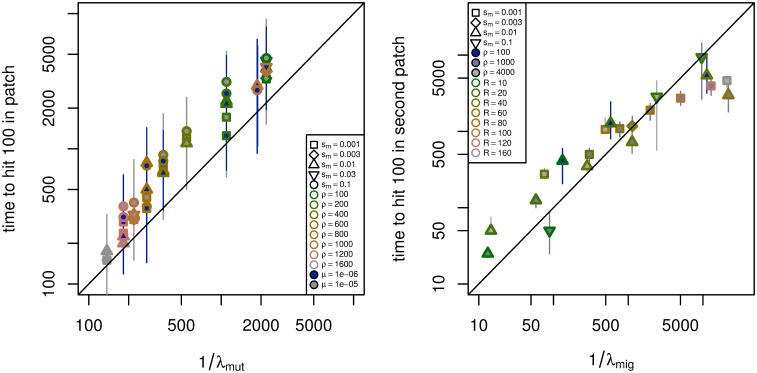
Fig 4. Observed versus predicted time until adaptation.
(left) Time until adaptation by mutation in an isolated patch for different combinations of selection coefficient on patches (s m), population density (ρ), mutation rate (μ), and distance between patches (R), as observed in simulations (vertical axis), and as predicted from Eq (2) (horizontal axis). In all simulations, s p = 0.01. (right) Time until adaptation by migration from an already occupied patch to a new patch, as observed in simulations (vertical axis), and as predicted from Eq (11), with C = 5 (horizontal axis). For each, parameter combinations and numbers of simulations are in supplemental S1 and S2 Tables; shown are the median (points) and interquartile range (lines) of the time until the patch had at least 100 adapted individuals, for each unique parameter combination. Only parameter combinations to which the theory here is applicable were used (precisely, if , patch width larger than , and s m > 2σρ); the remaining combinations are shown in S1 and S2 Figs.

