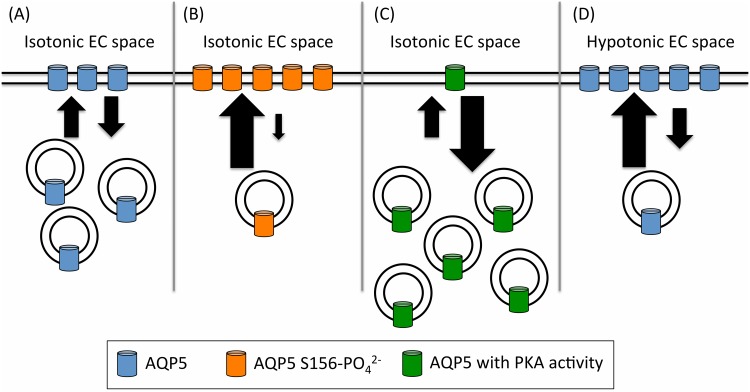
Fig 6. A proposed model of the equilibrium between vesicular and surface-localized AQP5.
Panel A shows wild-type AQP5 under isotonic conditions. The large arrows represent an increase in AQP5 translocation (and the small arrows are a decrease). This is regulated by three independent factors: Phosphorylation of AQP5 at position S156 (orange cylinders in panel B; shown by a phosphomimetic glutamate substitution (S156E) of AQP5; the effect of PKA (green cylinders in panel C) and the effect of decreasing the relative tonicity of the environment (panel D). We speculate that these three pathways control the surface abundance of AQP5.

