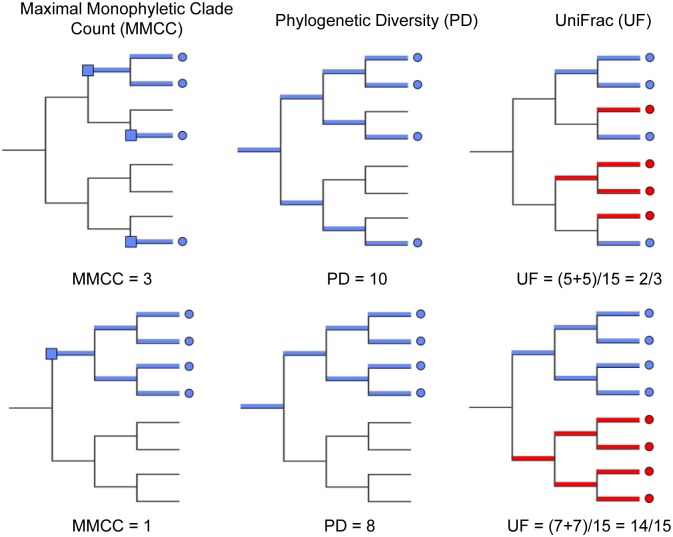
Fig 4. Diversity metrics illustrated graphically for a given phylogenetic tree and tip labeling.
The tips of the focus community are colored blue, and represent either the monkey or bat virus population. The uncolored or red tips represent the reference community. Branches in each case are colored according to whether and how the corresponding branch lengths would be counted for the given metric. The descriptions of each metric and how they are computed are presented in Results.

