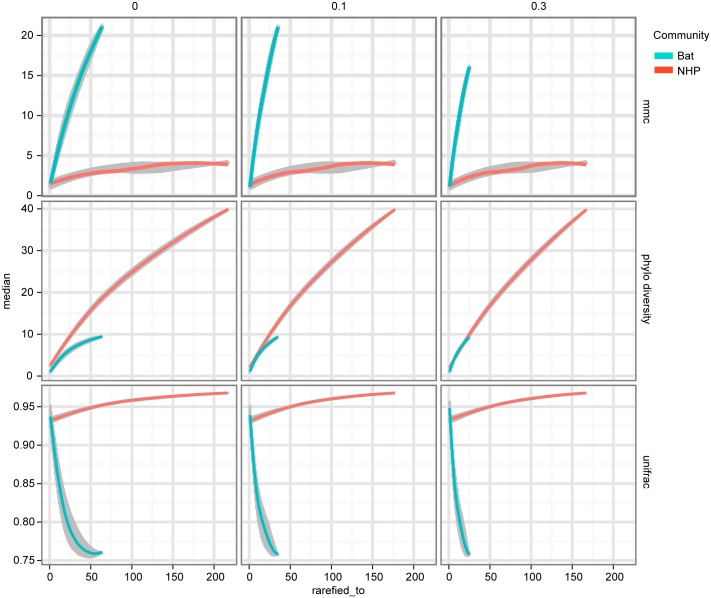
Fig 5. NHP and Bat AstV diversity are differently distributed with respect to the diversity of other canonical AstVs.
As described in Results, MMCC, Phylogenetic Diversity (PD) and UniFrac metrics are computed for each of two phylogenetic trees—one built with NHP AstV sequences, the other bat AstV sequences, both with a shared set of “reference community” astroviruses. The columns of plots represent different clustering thresholds meant to account for novelty bias in bat sequence submissions, while the x-axis represents subsampling to account for differences in sampling depth between the two populations. As we attempt to correct for the possibility of novelty bias, the phylogenetic diversity of the NHP AstVs begins to match that of the bat AstVs. The MMCC and UniFrac metrics indicate that across subsampling depths and novelty bias correction levels, bat AstVs are on average more distant from reference community viruses, and form more isolated clades. The error bars and central points are computed via the 50% confidence interval quantiles and medians from the random subsamples, and smoothed using R’s LOESS fitting.

