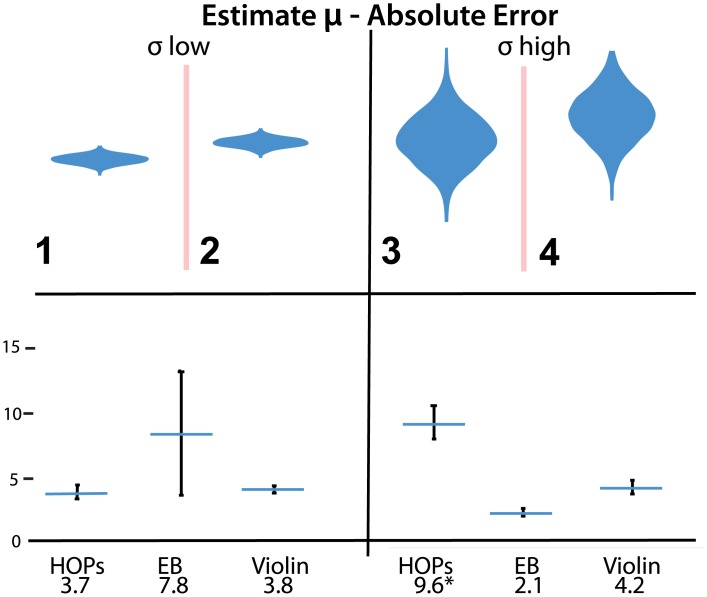
Fig 4. Stimuli (left) and absolute error (right) of estimates of μ.
Error bars indicate a 95% confidence interval. Error bars in the results plot show a 95% confidence interval. An animated version of this figure is available in the animated manuscript (S1 File).

