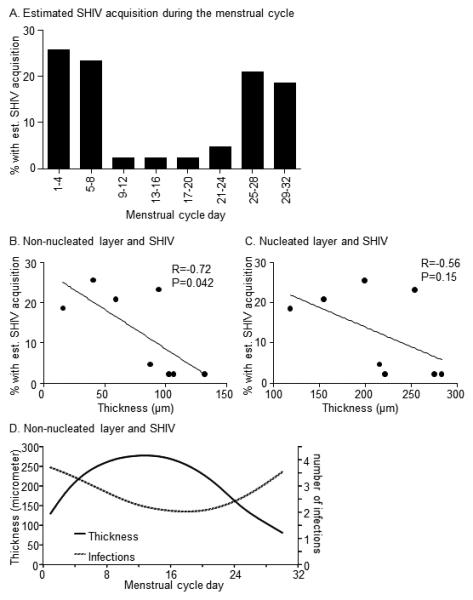
Fig. 4.

Relationship of epithelial thickness and susceptibility to SHIV infection A. The graph shows the percentage of 43 female pigtail macaques with est. (=estimated) SHIV acquisition time point at the indicated menstrual cycle segments of four days. The macaques became SHIVSF162P3 infected after repeated vaginal exposure at low virus dose, as published 24. Data were analyzed and plotted for 4-day intervals. B, C: Scatter plots of the thickness of mean vaginal epithelial layers during 4-day menstrual cycle segments, and the estimated SHIV acquisition in corresponding 4-day segments in 43 different macaques. The line represent linear regression analysis; R = Pearson co-efficient; p-value results from hypothesis test of non-zero slope. The right Y axis refers to the number of infections as reported in 24. D. Smoothed data were graphed to further examine the relationship of non-nucleated layer thickness and susceptibility to infection throughout the menstrual cycle.
