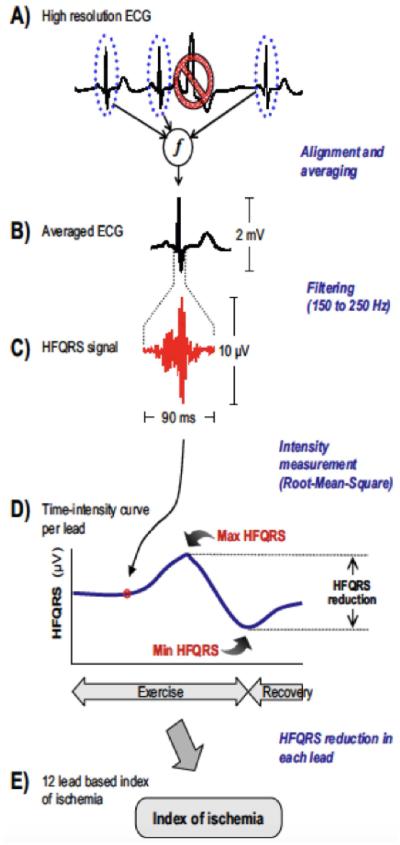
Figure 4. High frequency QRS analysis (HF-QRS).
Multiple representative QRS complexes are aligned and averaged. The signal in the 150-250 Hz frequency band is measured in each of the standard 12 leads, and a time intensity curve is generated. A decrease in the HF-QRS signal that is both ≥50% and ≥1µV in 3 or more leads is concerning for ischemia. ECG=electrocardiogram.With permission from Sharir et al.(35)

