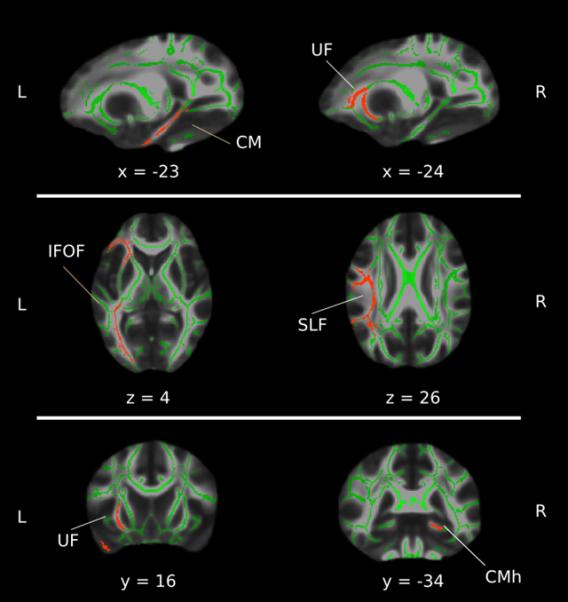
Fig. 1.

Graphical representation of the tracts included in the ROI analysis. From top to bottom: coronal, axial and sagittal views of the ROI, including CMh, UF, IFOF, SLF. The background image is the mean FA mask of the sample fitted in the MNI template. Shown in red are the tract included in the ROIs cropped on the FA skeleton map (in green). The image is reported in the neurological orientation, x, y, and z, coordinates are based on the MNI atlas.
