Fig. 1.
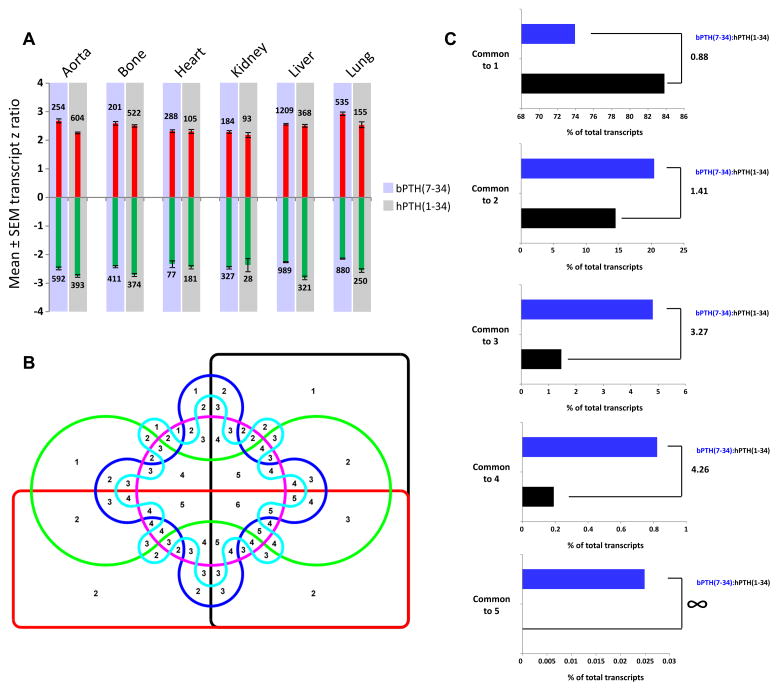
bPTH(7-34) significantly regulates gene transcripts in a more cross-tissue conserved manner than the endogenous hPTH(1-34) ligand. (A) Depiction of mean total transcript z ratios (upregulated transcripts – red bars; downregulated transcripts – green bars). The total number of up- or down-regulated transcripts per ligand in each tissue is indicated next to the corresponding bars. (B) Edwards 6-way Venn diagram employed to separate the patterns of cross tissue significant transcript regulation induced by the two PTH1R-stimulating ligands. The numbers in the intersections indicate the number of set commonalities (1 to 6). (C) Percentage distribution of hPTH(1-34) (black bars) or bPTH(7-34) (blue bars) of significantly regulated transcripts across Edwards Venn sectors common to 1, 2, 3, 4 or 5 tissues (no transcripts were found commonly regulated across all six tissues studied: aorta, bone, heart, kidney, liver, lung). The ratio of the percentage sector occupation between bPTH(7-34) and hPTH(1-34) is indicated next to the appropriate histogram.

