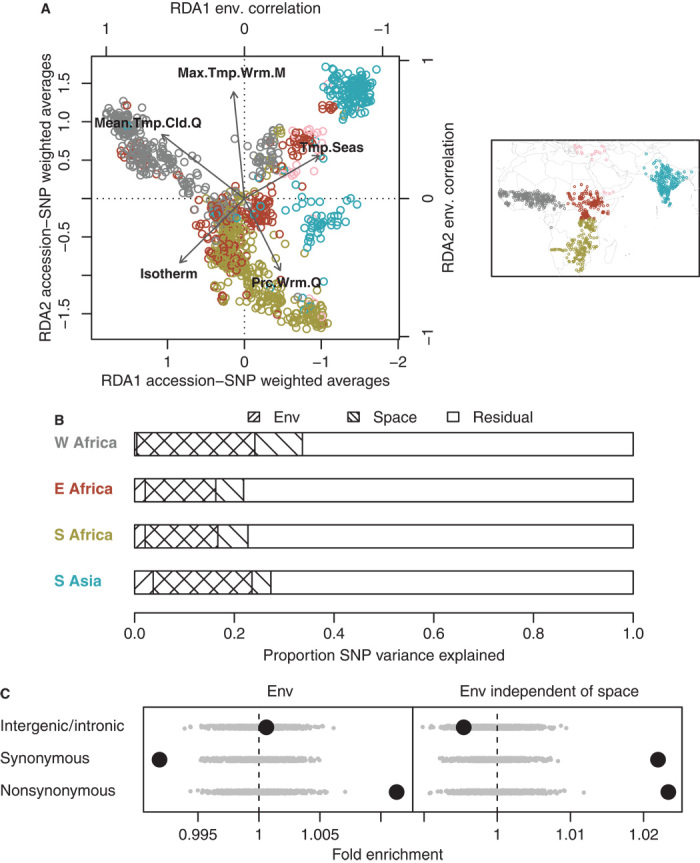
Fig. 3. Genome-wide, multivariate SNP-environment associations.

(A) Left panel shows the first two canonical axes (RDA1 and RDA2) of an RDA of variation in 871 SNPs among 1133 accessions (chosen to minimize missing SNP calls for accessions); inset map shows the geographic distribution of the accessions. Each canonical axis represents a linear combination of environmental variables (strongly loading variables shown as arrows) that explains variation in a linear combination of SNPs among accessions (colored points representing accessions from different regions: blue, South Asia; pink, Middle East; gray, West Africa; red, East Africa; green, South Africa). (B) Proportion of total SNP variation among accessions explained in RDA by environmental variables or spatial structure within each region (excluding Middle East). (C) Enrichment of three SNP categories for environmental structure, that is, the proportion of SNP variation among accessions (in all five regions) explained by environmental conditions. Gray dots represent 1000 circular permutations of SNP categories. The right panel shows enrichment for environmental structure after removing geographic spatial structure in SNP variation via partial RDA (akin to partial regression).
