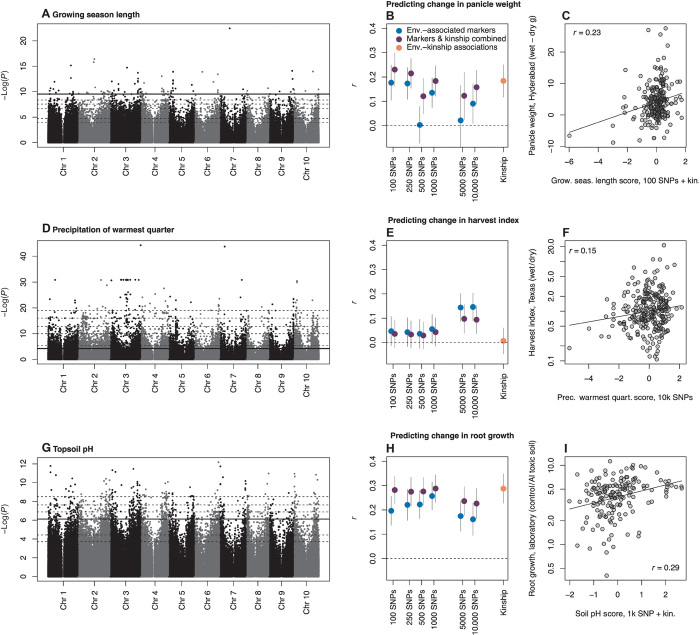
Fig. 4. Genome-wide associations with environment (A, D, and G) used to predict change in phenotypes across treatments for breeding lines and landraces (circles in C, F, and I), and comparisons of predictions using different numbers of predictor SNPs (B, E, and H).
The best prediction is shown for each trait in (C), (F), and (I). Note that phenotype data were not used in predictions. There were three experiments testing the effects of (i) drought treatment late in growing season in Hyderabad, India (A to C), (ii) drought treatment across growing season in Austin, United States (D to F), and (iii) aluminum toxicity in the laboratory (G to I). Horizontal dashed lines (A, D, and G) show P value thresholds delineating the nested subsets of SNPs with the strongest associations to environment tested in (B), (E), and (H). The solid horizontal line (A, D, and G) shows the set of SNPs giving the best predictions (C, F, and I; r = Pearson’s correlation coefficient). In (C) and (I), the best model combined the subset of SNPs indicated and genome-wide SNP similarity (“kinship”). SE bars (B, E, and H) were generated using nonparametric bootstraps of sampled accessions. Predictions were standardized to z scores (x axes of C, F, and I). Drought treatment data were generated here; aluminum toxicity response data are from (44). Because of skew in the data, the y axes in (F) and (I) are shown as proportions with log scaling.

