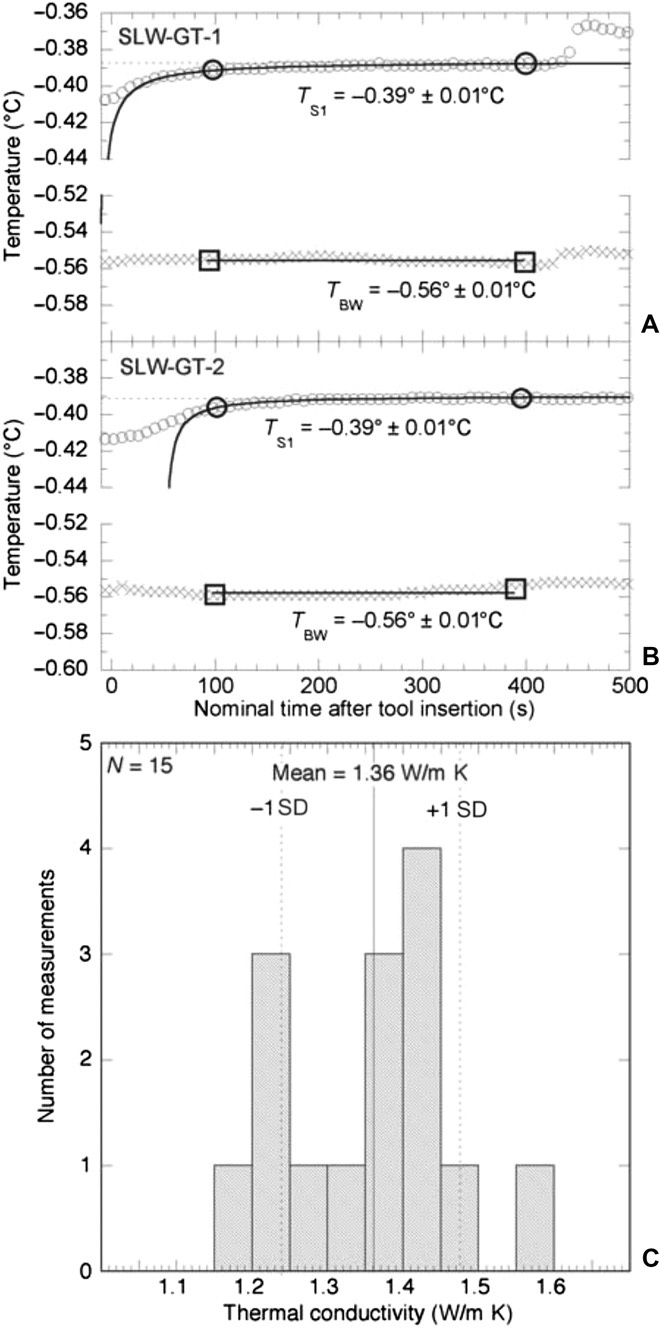
Fig. 2. Thermal data and interpreted values.

Processing details and complete field records are included in Materials and Methods and the Supplementary Materials, respectively. (A) Temperature-time record after probe penetration during the first tool deployment below SLW, as modeled to derive equilibrium temperature. Every fourth data point is shown for clarity. The solid curve shows the fit of data from sensor TS1 (open circles) to an analytical model for tool equilibration in sediments after penetration. The large circles show the range of TS1 data fit with the model. The horizontal dotted line shows the equilibrium temperature for TS1. Record from the bottom water probe, TBW (x symbols), was averaged over the interval shown (between large squares) to calculate bottom water temperature. (B) Temperature-time record after probe penetration during the second tool deployment below SLW, as modeled to derive equilibrium temperature. Symbols are the same as in (A). (C) Compilation of thermal conductivity values determined on sediment core recovered using the gravity multicorer.
