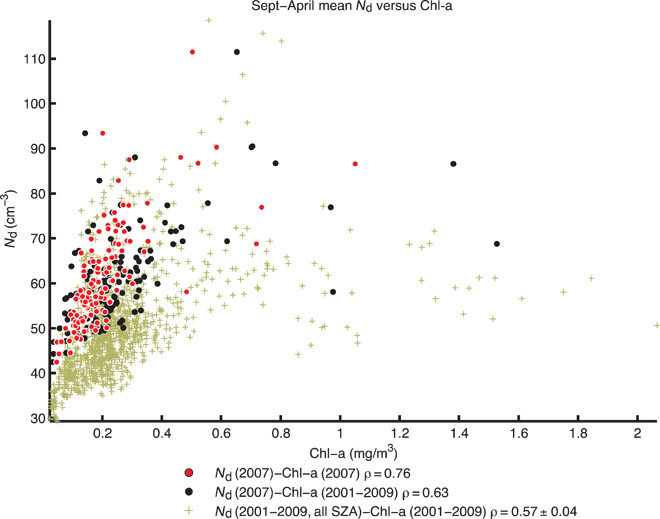
Fig. 1. Elevated mean September to April cloud droplet concentrations over the SO are associated with regions of high Chl-a (indicating the presence of phytoplankton biomass).

Spring-summer-autumn (September to April) mean values of Nd are shown as a function of SeaWiFS Chl-a (for 5° latitude × 15° longitude boxes from 35° to 55°S). Three comparisons are shown: Nd from 2007 only using retrievals SZA <65° versus Chl-a from 2007 (red); Nd from 2007 (only retrievals with SZA <65°) versus a climatology of Chl-a from 2001 to 2009 (black); and Nd from each year from 2001 to 2009 (all retrievals) versus Chl-a from each year from 2001 to 2009 (brown). The Spearman rank correlations are 0.76, 0.63, and 0.57 ± 0.04, respectively, where the mean and SD of the latter is calculated from the individual correlations from each year from 2001 to 2009.
