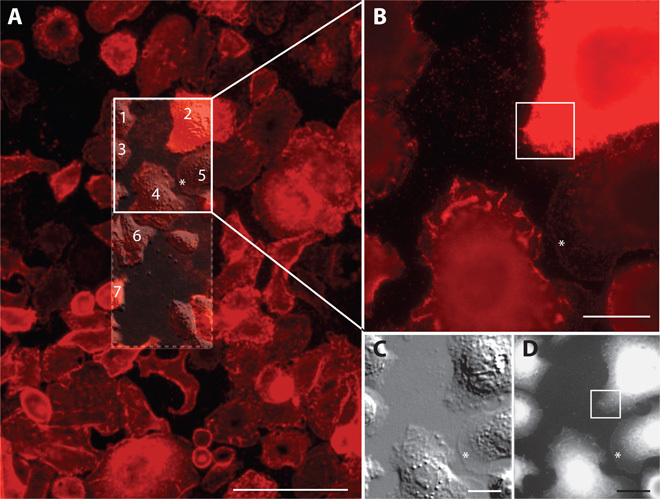
Fig. 2. Correlative light and electron microscopic overview images of affibody-QD–labeled HER2 on SKBR3 human breast cancer cells.

(A) Fluorescence overview image of the central region of a microchip, showing several dozen cells. Individual cells exhibit a high degree of heterogeneity in their morphology and HER2 membrane expression. The location of the SiN membrane window is indicated as a rectangular dashed outline. A differential interference contrast (DIC) image of the window area is overlaid. The DIC image provides an impression of the three-dimensional topography. Scale bar, 100 μm. Cells from which ESEM-STEM images were recorded are indicated by numbers. (B) Higher-resolution fluorescence image, recorded with a 63× oil immersion lens, of the cells in the upper half of the window area, marked as a solid line rectangle in (A). The fluorescence signal of cell #2 indicated a high level of HER2 membrane expression, whereas cell #5 showed only weak HER2 membrane expression. Cell #4 concentrated HER2 on membrane ruffles. The boxed area is shown in Fig. 3A. (C) DIC image of the same region as in (B), depicting the membrane topography in greater detail. (D) ESEM-STEM image from the same region as shown in (B) and (C) (×1000 magnification). Scale bars, 20 μm.
