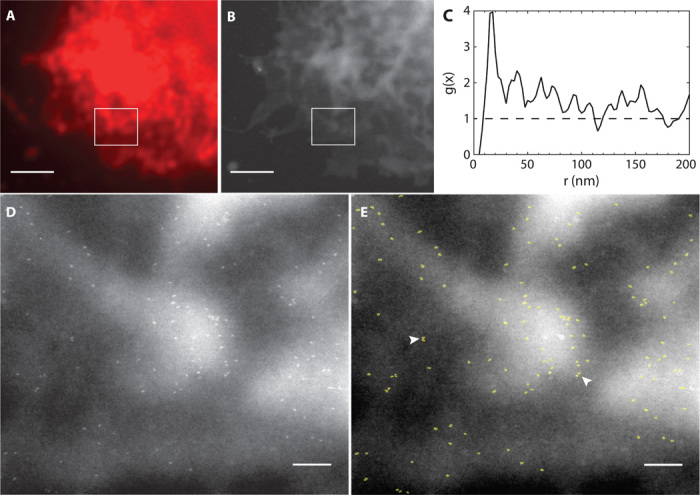
Fig. 3. Correlative light and electron microscopic images showing the distribution of QD-labeled HER2 on an SKBR3 cell.

(A) Selected area of the fluorescence image in Fig. 2B. This region contained membrane ruffles as shown in the DIC image of Fig. 2C. (B) ESEM-STEM image at the same area, recorded at ×15,000 magnification. (C) Pair correlation function g(x) (line) determined from the 122 detected label positions in the rectangular region in (B). The dashed line at unity serves as a guide to the eye for a random distribution. (D) STEM image recorded of the boxed region shown in (B) at ×75,000 magnification. The localization of individual HER2 receptors became visible as the bright, bullet-shaped QDs. (E) Automatically detected labels were outlined in light green. Numerous pairs of HER2 were observed (two examples are indicated by arrowheads). Scale bars, 2 μm (A and B); 200 nm (D and E).
