
Fig. 5. Correlative light and electron microscopy of a cell with ruffles.
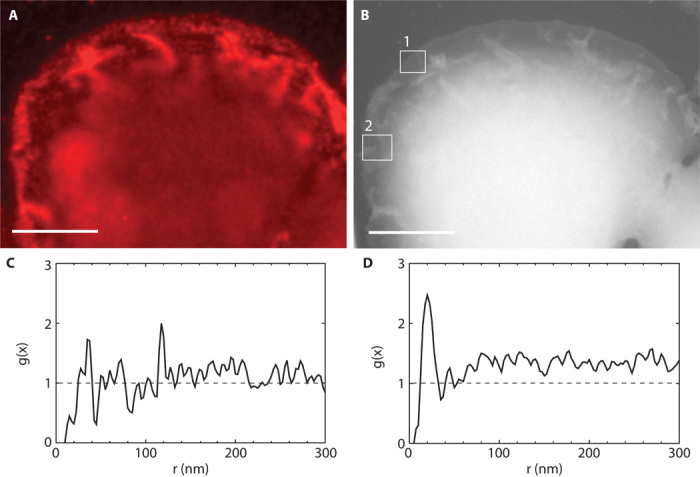
(A) Fluorescence image of a selected region at the edge of cell #11. (B) Same area as in (A) but imaged with ESEM-STEM. Several membrane ruffles are visible as structures of increased brightness. (C) An ESEM-STEM image was recorded at the location #1 in (B) of a region with homogeneous membrane topography, without ruffles. The g(x) function indicated a random distribution of 209 automatically detected QD label positions. (D) Region #2 in (B) contained membrane ruffles. The curve of g(x) determined from 417 label positions in the ESEM-STEM image in the area contained a peak at 20 nm and also pointed toward clustering at larger distances. Scale bars, 10 μm.