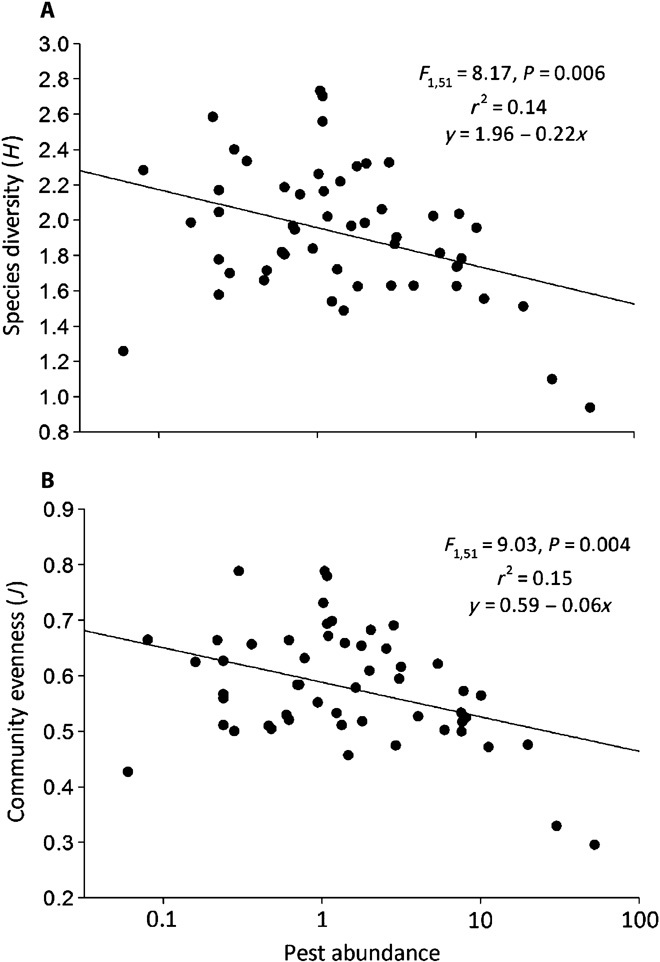
Fig. 1. High biodiversity is correlated with low pest abundance in maize.

(A and B) Here, biodiversity is measured as the Shannon Index (A) and community evenness (B). Each data point represents a single farm; the complete foliar arthropod community was identified at each field, and the pest abundance (Diabrotica spp., lepidopteran pests, and aphids) per plant (log-transformed) was enumerated.
