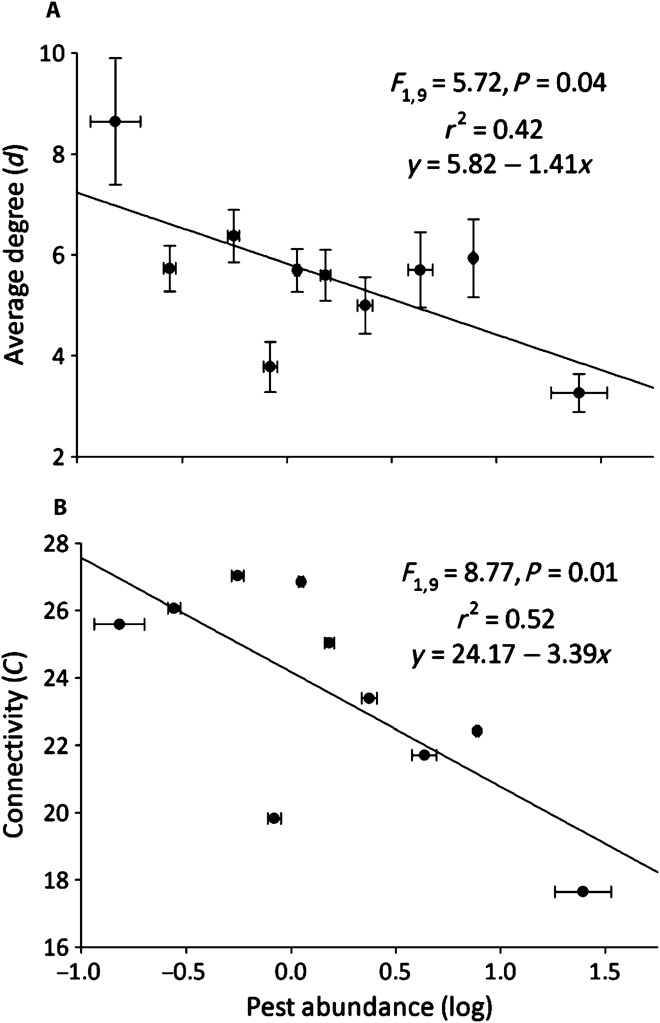
Fig. 2. Increasing network linkage strength and reduced pest populations in maize.

(A and B) Here, network strength is represented as the average proportion of linkages per species relative to those possible within the network (degree; A) and the average number of linkages per species within the network (connectivity; B). The entire foliar arthropod community was described on 53 maize farms, and pest abundance (Diabrotica spp., lepidopteran pests, and aphids) per plant was recorded. Farms were assigned to 1 of 10 groups based on their pest abundance (n = 5 to 6 farms each), and pairwise Spearman correlation tests were conducted for all taxa within the community; linkages were assigned to significant coefficients. Error bars represent SEM. Connectivity (Randić connectivity index) is a network-wide metric, so variance is not applicable.
