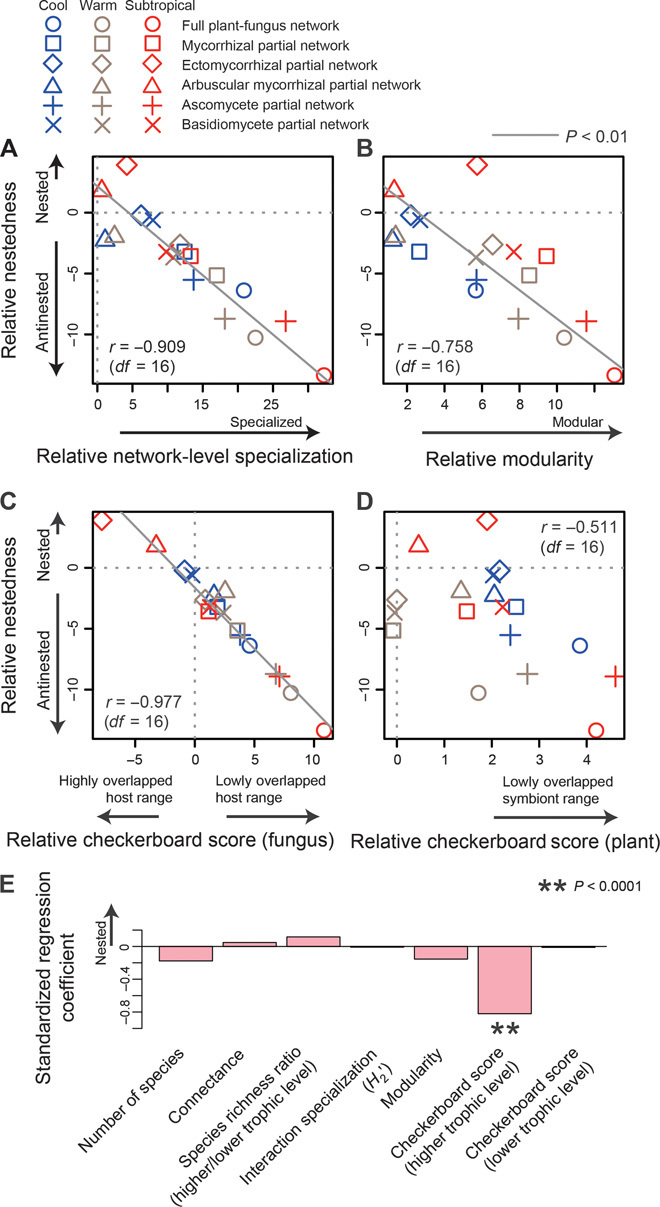
Fig. 4. Network properties explaining variation in (anti)nestedness.

(A to D) Weighted NODF nestedness (vertical axes) and other network indices (horizontal axes) were calculated for each plant–fungus network or partial network. Positive/negative values indicate that network index estimates of observed plant–fungus association matrices are larger/smaller than those of randomized matrices (that is, relative nestedness, etc.). There was a significant correlation between nestedness and network-level specialization (A) or modularity (B). Further conspicuously, stronger antinestedness was observed for the networks and partial networks with less host-plant overlap in fungal communities (C). The extent of the within-plant-community overlap of fungal symbionts displayed no relationship with network nestedness (D). (E) Multiple regression analysis (df = 10) further indicated that variation in relative nestedness was solely explained by the extent of host range overlap among fungal species.
