
Fig. 2. Higher levels of MED12 and CARM1 correlate with better response to chemotherapy drugs in cell line models and clinical cohorts.
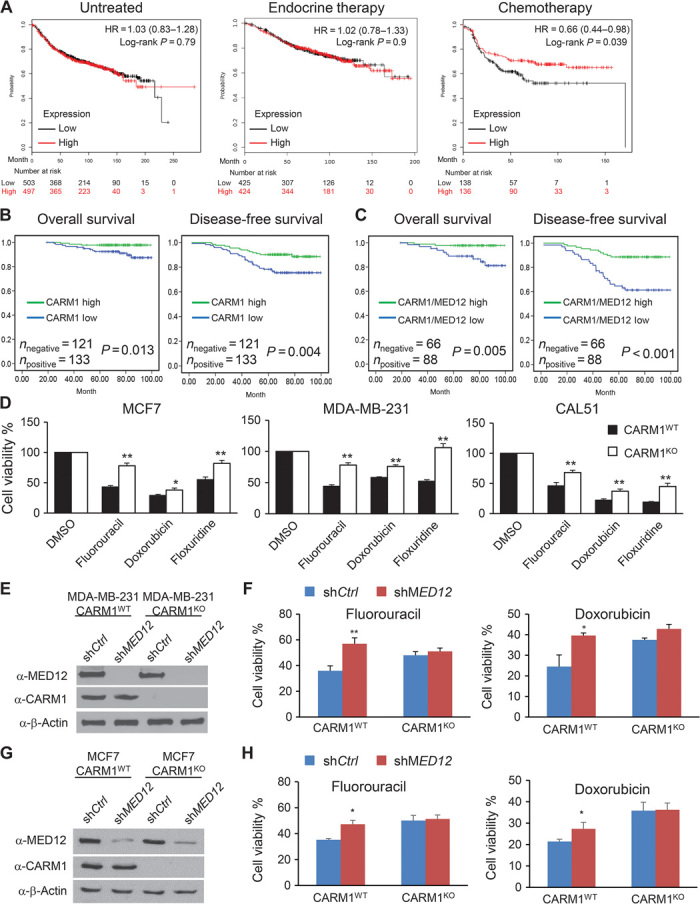
(A) KM curves stratified by MED12 mRNA levels depicting the probability of RFS in untreated, endocrine therapy–treated, or chemotherapy-treated breast cancer patients. Patient samples were divided into MED12high and MED12low groups based on the median of the expression level of MED12. Affymetrix gene ID 214275_at was used to plot the survival curves of MED12 using data sets from Gene Expression Omnibus (GEO) (Affymetrix HG-U133A and HGU-133+2 microarrays), European Genome-Phenome Archive (EGA), and The Cancer Genome Atlas (TCGA). HR, hazard ratio. (B and C) High levels of CARM1 and MED12 proteins correlate with better survival after 5-fluorouracil (5-FU) or doxorubicin treatment in breast cancer patients with 100-month follow-up (n = 254). KM estimates of DFS and OS of human patients according to the expression levels of CARM1 (n = 254) or CARM1/MED12 (n = 154). Comparison was made between groups with high or low levels of CARM1 alone or high or low levels of CARM1 and MED12. P value refers to two-sided log-rank tests. (D) Cell viability analyses of three paired CARM1WT and CARM1KO breast cancer cell lines after incubating with 1 μM 5-FU, doxorubicin, or floxuridine for 72 hours. Cell viability was determined by MTT assays. Quantitative data are presented as averages ± SD. Student’s t test was used for statistical analysis. *P < 0.05; **P < 0.01. (E) Western blotting shows the knockdown of MED12 in both CARM1WT and CARM1KO MDA-MB-231 cells. (F) Cell viability analyses of MDA-MB-231 CARM1WT shCtrl, MDA-MB-231 CARM1WT shMED12, MDA-MB-231 CARM1KO shCtrl, and MDA-MB-231 CARM1KO shMED12 cells after treatment with 5-FU or doxorubicin for 72 hours. Quantitative data are presented as averages ± SD. Student’s t test was used for statistical analysis. *P < 0.05; **P < 0.01. (G) Western blotting shows the knockdown of MED12 in both CARM1WT and CARM1KO MCF7 cells. (H) Cell viability analyses of MCF7 CARM1WT shCtrl, MCF7 CARM1WT shMED12,MCF7 CARM1KO shCtrl, and MCF7 CARM1KO shMED12 cells after treatment with 5-FU or doxorubicin for 72 hours. Quantitative data are presented as averages ± SD. Student’s t test was used for statistical analysis. *P < 0.05.