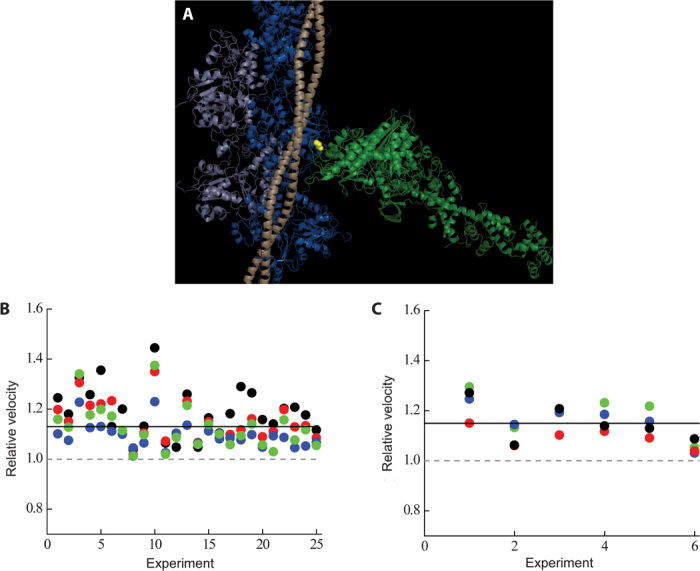
Fig. 1. The position of R403 in the myosin molecule in the context of actin and tropomyosin and its effects on unloaded motility.

(A) The R403 residue (yellow spheres) resides in a loop at the actin-binding domain of the myosin molecule (light green) and recently has been postulated to interact with both actin (light and dark blue) and tropomyosin (light wheat) (45). The structure is a modification of the Protein Data Bank (PDB) file, 2TM1 [submitted by Behrmann et al. (45)] with a chimera of the human β-cardiac myosin motor domain (PDB: 4DB1; residues 1 to 777) and chicken lever arm (PDB: 2MYS; residues 780 to 843) along with the human ELC and RLC (the S1 domain of myosin, light green) docked in. (B) Normalized motility parameters for human β-cardiac R403Q with respect to wild type. Experimental outcomes of MVEL (black), MVEL20 (red), TOP5% (blue), and PLATEAU (green) for different experiments, performed at 23°C, are shown for R403Q with respect to wild type (the wild-type value is normalized to 1 and is denoted as a gray dashed line). The solid line denotes ~15% increase in all the motility parameters for human β-cardiac sS1 R403Q (P < 0.01). (C) Same as (B), except that the experiments were performed at 30°C. A ~15% increase for all velocity parameters of R403Q sS1 was also observed at this temperature (P < 0.01). MVEL is the mean of the velocity distribution of moving actin filaments and excludes any filaments that are stuck. The percentage of stuck filaments for the human β-cardiac sS1, after dead-head removal (see Unloaded and loaded in vitro motility under Materials and Methods), is typically 5 to 10% for a given myosin preparation. MVEL20 is a 20% tolerance-filtered mean velocity. This parameter is calculated by eliminating intermittently moving filaments with velocities fluctuating more than 20% of the mean velocity. TOP5% is the mean of the top 5% of the velocities of all moving filaments. PLATEAU is the mean velocity obtained from fitting a single exponential function to the maximum velocities across different actin lengths. See fig. S2 for a representative example of these parameters. A complete description of this methodology can be found in (37), and the FAST software used for analysis is available for downloading on our Web site (http://spudlab.stanford.edu/FAST.html).
