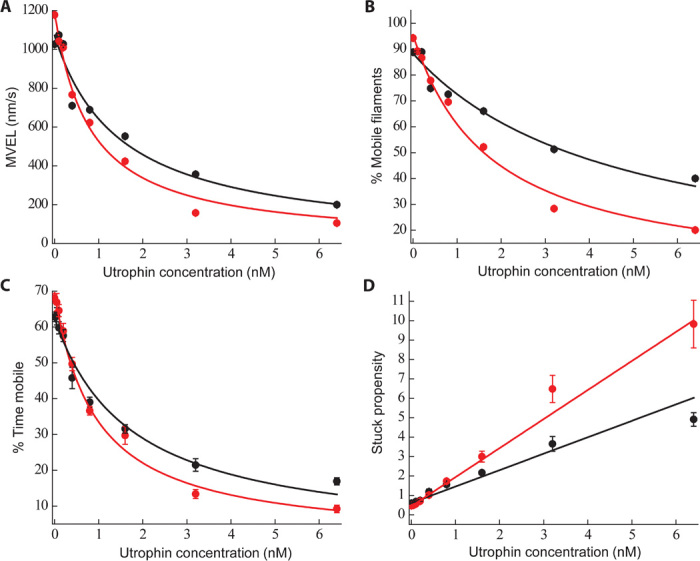
Fig. 7. Loaded motility parameters for wild-type and R403Q human β-cardiac sS1 with RTFs.

(A and B) Representative MVEL (A) and percentage of mobile filaments (B) as a function of utrophin concentration for wild type (black circles) and R403Q (red circles). Solid lines are exponential fits as a guide to the eye (black for wild type and red for R403Q). (C) Percent time mobile data for wild type (black circles) (n = 4 exp, 4 preps) and R403Q (red circles) (n = 4 exp, 4 preps). Percent time mobile is defined as the product of percentage of mobile filaments (A) and MVEL (B) normalized by unloaded TOP5% velocity. Errors reported are SEM. Fits are according to the Stop model described by Aksel et al. (37). (D) Alternative representation of percent time mobile data as stuck propensity, which is equivalent to (100 − percent time mobile) divided by percent time mobile (black circles for wild type and red circles for R403Q). Errors reported are SEM. Unloaded stuck propensity is subtracted from each point. The solid line (black for wild type and red for R403Q) shows the best linear equation fit to the data points. The steeper slope for R403Q as compared to wild type suggests it to be a lower-force generator.
