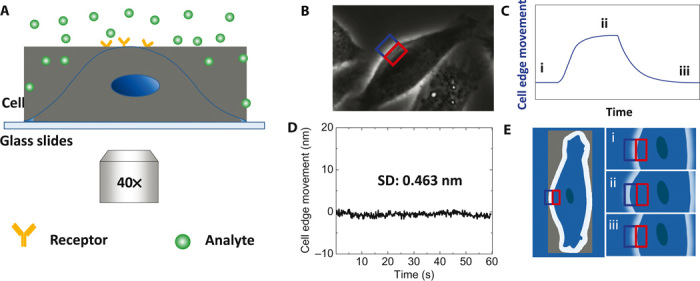
Fig. 1. Detection of molecular interactions with membrane proteins in cells through mechanical amplification.

(A) Schematic illustration of the experimental setup based on an inverted phase-contrast microscope with a 40× phase 2 objective. (B) Differential optical detection for accurate tracking of cell edge changes induced by analyte-receptor interaction. (C) Schematic of a typical binding curve as determined from the cell edge movement. (D) The root mean square of the fixed cell edge change is 0.46 nm. (E) Illustration of cell edge changes over time during the binding process, where i, ii, and iii correspond to the stages marked in (C). Blue and red rectangles in (B) and (E) are the ROIs for differential detection.
