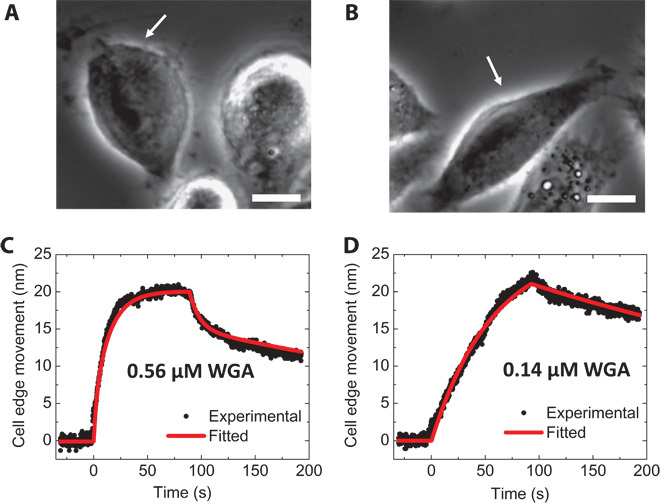
Fig. 2. Large molecule interactions: WGA interaction with glycoproteins.

(A and B) Phase-contrast images of fixed CP-D cells with binding of WGA [0.56 μΜ (20 μg/ml) (A) and 0.14 μM (5 μg/ml) (B)]. The white arrows mark the cells under analysis. (C and D) Averaged cell edge movement over the whole cell (black dots) and global fitting (red curves) for 0.56 μΜ (20 μg/ml) (C) and 0.14 μM (5 μg/ml) (D) WGA, respectively. Scale bars, 10 μm.
