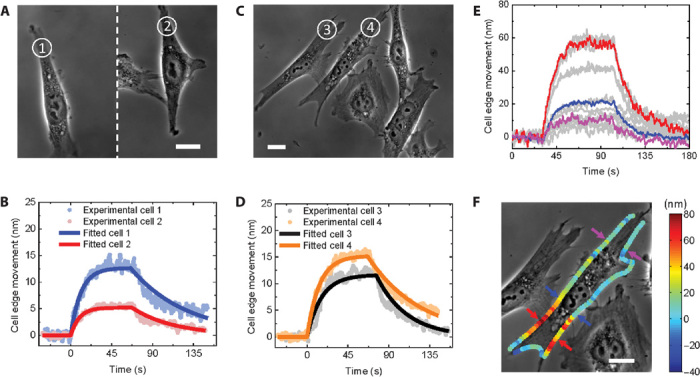
Fig. 4. Heterogeneity of small-molecule interactions with cell membrane receptors.

(A and C) Phase-contrast images of fixed hα4β2-transfected SH-EP1 cells, where the numbers mark the cells under analysis. Scale bars, 20 μm. (B) Binding kinetics of cells 1 and 2 (100 nM acetylcholine). (D) Binding kinetics of cells 3 and 4 (100 nM acetylcholine). (E) Binding kinetics at different locations of the cell in (F) (100 nM acetylcholine). (F) Phase-contrast image of a fixed hα4β2-transfected SH-EP1 cell. The color represents the amount of cell membrane edge deformation. Scale bar, 20 μm.
